How to identify the 200–400 items that define what your store is worth in a shopper's mind
Summary
Shoppers judge a store's entire pricing reputation on just 200–400 Key Value Items (KVIs) — typically 0.5–1.5% of assortment. Get these right and price image improves even where most of the range sits above market; get them wrong and no amount of broader investment fixes it.
Most retailers still identify KVIs by sales volume and merchant instinct, producing lists that are too large, too static, and often wrong. This paper condenses a structured, evidence-based methodology — drawn from McKinsey's frameworks and RapidPricer's RASPER experience — for identifying, tiering, and maintaining a defensible KVI list, and connects it to RapidPricer's Pricing Health Check.
1. The Price-Perception Paradox
Shoppers actively recall prices for fewer than 20 items on a typical trip. A 30,000-SKU retailer's entire price image rests on roughly 0.5–1.5% of its range — concentrated in high-frequency, strongly branded products with genuine external reference points.
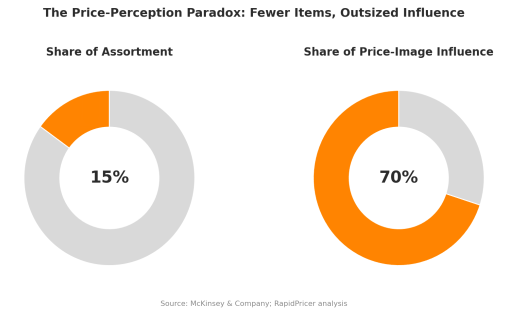
McKinsey found key value categories can generate up to 80% of grocery revenue but only half of profit — margin sacrificed there must be recovered in the long tail where shopper price recall is negligible.
| Key Finding Retailers using volume rank as a KVI proxy generate 40–60% false-positive rates (ClearDemand, RELEX). High volume reflects demand at the current price — it does not confirm price awareness or elasticity. |
|---|
2. Start with Categories: The KVC Screen
KVI scoring should be restricted to Key Value Categories (KVCs) — categories where price perception forms most strongly — rather than run across the full assortment. Price-sensitivity is category-shaped, not a SKU-level constant.
| KVC Criterion | Weight | Operational Definition |
|---|---|---|
| Purchase Frequency | 40% | ≥ 2×/month (grocery); ≥ 4×/year (non-food) |
| Customer Reach | 40% | ≥ 30% of shopping baskets contain the category |
| Promotional Share | 20% | Category appears in > 15% of promotional features |
Table 1 · KVC Scoring Criteria for Frequently-Bought Items | Source: McKinsey & Company (2016); RapidPricer
McKinsey's European nonfood study found ~200 KVCs out of 1,000+ categories accounted for over 50% of sales — the same pareto structure seen in frequently-bought retail.
3. The Five-Step KVI Identification Process
Each step sequentially eliminates items lacking genuine price-anchor characteristics, narrowing the full KVC assortment down to the final KVI list.
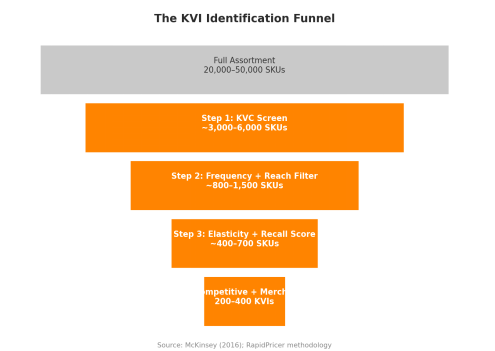
| Step | Filter | Decision Rule |
|---|---|---|
| 1 | Value / Deal Signal | Priced below category median or recognised brand at accessible price |
| 2 | Penetration & Frequency | ≥ 8% of baskets containing the KVC, monthly velocity |
| 3 | Own-Price Elasticity | |ε| ≥ 0.6 grocery / ≥ 0.4 non-food, controlling for competitor prices |
| 4 | Competitive Transparency | Listed by ≥ 2 competitors; price on ≥ 1 comparison platform |
| 5 | Merchant Overlay | Category manager judgment: strategic importance, supplier co-investment |
Table 2 · Five-Step KVI Identification Filter | Source: McKinsey (2016); RapidPricer RASPER
Weighting differs by format: grocery leans on purchase frequency and reach (repetition builds memory); non-food leans on competitive transparency and recall (infrequent purchase cycles need external verification).
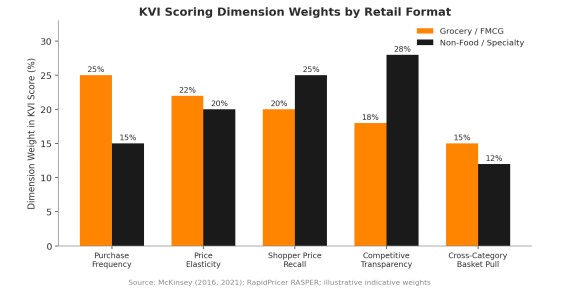
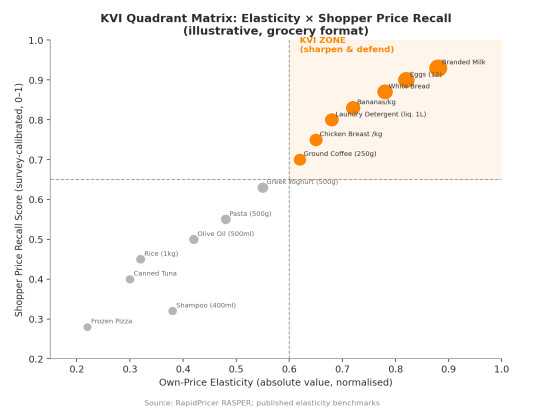
The elasticity × recall quadrant is the analytical core: items with both high elasticity and high recall are unambiguous KVIs. High-elasticity/low-recall items suit promotional investment; high-recall/low-elasticity items need to be “fair,” not “lowest.”
4. Three-Tier KVI Segmentation
Confirming an item is a KVI is only step one — the pricing rule, monitoring frequency, and tolerance for being above market depend on which tier it sits in.
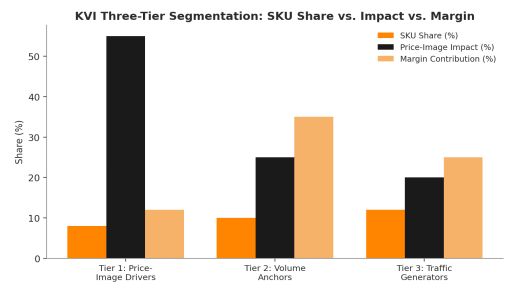
- Tier 1 – Price-Image Drivers: milk, eggs, bread. Priced at/near market minimum (≤€0.05 sub-€5 items); reviewed monthly, monitored daily.
- Tier 2 – Volume Anchors: high-penetration category volume drivers. “Competitive parity” posture (±5% of median); reviewed quarterly.
- Tier 3 – Traffic Generators: seasonal/event-driven items. KVI status is time-bounded; rotate in/out quarterly, no ongoing monitoring off-window.
The most common failure: applying Tier 1 “match market minimum” rules to Tier 2 items out of conservatism. A Health Check audit typically finds 30–50% of KVI spend misallocated across tiers.
5. The Economics of KVI Investment
Price investment landing on items shoppers actually track delivers disproportionate price-image return per margin point spent, versus broad discounting.
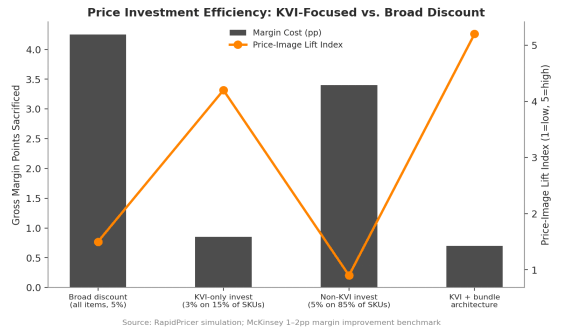
Broad 5% discounting costs 4.25 margin points for weak price-image lift. KVI-only investment at 3% on 15% of SKUs costs one-fifth as much and delivers more than double the lift — because every discounted item sits inside the shopper's active comparison set. McKinsey's benchmark: 1–2 percentage points of net margin improvement from systematic KVI pricing, funded by margin recovery on background items.
- Safe margin-recovery candidates need: low shopper price recall (<30% unaided), low elasticity (|ε| < 0.3), and low cross-elasticity to any KVI.
6. Keeping KVIs Current
A KVI list set once a year is the most common execution failure in retail pricing — competitor moves, new product entries, and tariff-driven repricing all shift which items shoppers track within months, not years.
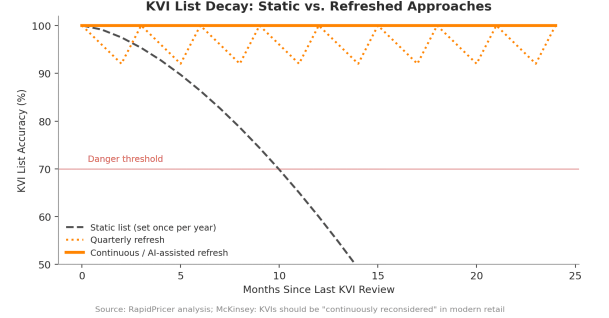
Recommended cadence: Tier 1 reviewed monthly, Tier 2 quarterly, Tier 3 pre-season; full list composition revalidated twice yearly. Warning signs an update is overdue include extended competitor promotions on off-list items, declining price-perception scores despite a steady competitor price index, and private-label share crossing 30% in a category.
7. Five Common KVI Identification Errors
| Error | Corrective Action |
|---|---|
| Too many KVIs (>25% of assortment) | Cap at 10–20% of total assortment; enforce quota by category |
| Volume used as KVI proxy | Always score on elasticity and recall, not volume rank alone |
| Static annual review cycle | Refresh quarterly minimum; monthly for top-50 Tier 1 KVIs |
| Uniform pricing across tiers | Apply distinct price rules and monitoring cadence per tier |
| Ignoring cross-elasticity | Model cross-format/category elasticity before setting discount depth |
Table 3 · Common KVI Identification Errors | Source: McKinsey; RELEX Solutions; RapidPricer
8. Connecting to the Pricing Health Check
This methodology is the analytical backbone of RapidPricer's Pricing Health Check — a fixed-scope, NDA-covered assessment on the retailer's own data that produces a structured KVI candidate list with composite scores, tier assignments, and pricing rules, ahead of any larger platform commitment.
- KVI list is 10–20% of assortment (200–400 items for mid-size formats)
- Three operational tiers with genuinely differentiated pricing and monitoring rules
- Refreshed ≥ quarterly, Tier 1 monthly
- Tier 1 price position within tolerance of competitor minimum on ≥ 95% of items daily
- Background-item margin audited for intentional recovery on low-recall, low-elasticity SKUs
- List validated against shopper survey recall data within the past 12 months
Most retailers coming to the Health Check satisfy only two or three of these six criteria — that gap is where the measurable margin opportunity lives.
Conclusion
KVI identification is the foundational act of retail pricing strategy: the choice of where to compete on price and where to recover margin. Done rigorously, it produces a defensible 200–400 item list, tiered into distinct operational rules and refreshed continuously. The opportunity isn't spending more — it's spending correctly in the rig
“Value is becoming a system, not a lever. Advantage will depend less on individual levers such as price and more on how effectively retailers align these elements into a coherent model that reflects how consumers actually shop.” — McKinsey, State of Grocery in North America (2026)
Sources and Further Reading
- McKinsey & Company, "How Retailers Can Improve Price Perception — Profitably" (2016). Primary source for KVC/KVI weighting criteria, nonfood retailer case study, and European grocery benchmark data.
- McKinsey & Company, "Pricing in Retail: Setting Strategy" (2015). Source for four KVI types (value-perception drivers, assortment-perception drivers, traffic generators, margin drivers) and the 200–300 to 1,000+ dynamic list evolution.
- McKinsey & Company, "Pricing and Promotions: The Analytics Opportunity" (2021). Source for three-tier segmentation (KVI / foreground / background) and the 10–20% assortment share guideline.
- McKinsey & Company, "The State of Grocery in North America" (June 2026). Context for 2026 KVI strategy and the "value as system" framing.
- McKinsey & Company, "Value-for-Money Perception Must Exceed Price for European Grocers" (2021). Source for per-store KVI customisation and competitor war-gaming methodology.
- McKinsey & Company, "How Retailers Can Drive Profitable Growth Through Dynamic Pricing" (2017). Source for the European nonfood retailer KVI scoring module (0–100 index, multi-signal weighting).
- RELEX Solutions, "How Price Optimization of Key Value Items (KVIs) Can Expand Market Share" (2025). Industry perspective on elasticity-based KVI identification and the limitation of gut-feel approaches.
- ClearDemand, "How Grocery KVI Analysis Drives Better Pricing Decisions" (2026). Benchmark data on KVI list management and automated monitoring.
- Competera, "Key Value Items (KVI): What They Are & How to Use Them in Retail Pricing" (2025). Synthesis of McKinsey frameworks and digital-era KVI identification criteria including search volume and comparison-platform transparency.
- PriceN.ai, "KVI Pricing for Retailers Who Refuse to Guess" (2026). Practical cross-price elasticity headroom analysis and three-tier pricing rule framework.
RapidPricer helps automate pricing and promotions for retailers. The company has capabilities in retail pricing, artificial intelligence, and deep learning to compute merchandising actions for real-time execution in a retail environment.