
Recommerce & Refurb at Scale — Grading Curves, Trade-In Economics, and the Resale Floor
RapidPricer Insights · July 2026 · 8 min read
Recommerce is being sold to the market as a sustainability story. It is really a pricing story wearing a sustainability story's clothes. Every refurbished unit that clears at a fair price is a device that stays out of landfill; every unit that doesn't clear — because it was graded wrong, credited too generously at intake, or left on the shelf past its markdown window — becomes an inventory write-off with a carbon cost already sunk into it. The circularity claim is only as strong as the pricing discipline underneath it.
| $68–103B 2025/26 global refurbished-electronics market (range across estimates) | 10–13% CAGR through the early 2030s across major market forecasts | 14% of mobile phones in active global use bought used or refurbished (GSMA, 2024) | 68% of Gen Z/Millennial shoppers who bought secondhand in 2024 (ThredUp) |
|---|
This piece sets aside the growth narrative — it's well covered elsewhere — and works through the three pricing mechanics that determine whether a recommerce or trade-in program actually makes money: how condition is translated into a grading curve, how the resale floor is set and defended as inventory ages, and how trade-in credit is priced against the resale value it's meant to fund.
1. The pricing problem circular economy forgot
Retailers and OEMs have spent the last three years building the operational side of recommerce — grading stations, diagnostics, reverse logistics, certified-refurbished branding. Comparatively little discipline has gone into the pricing layer that sits on top of it. Three decisions, made mostly by category managers using rules of thumb inherited from clearance pricing, determine program economics almost entirely:
- How much the grading curve pays for each condition tier, and how fast that curve should decay with age.
- Where the resale floor sits, and how quickly a unit should be marked down toward it before it becomes a write-off.
- How much trade-in credit to offer at intake, since every euro of credit is a claim on a resale value that hasn't been realized yet.
Each of these is a genuine estimation problem — not a policy choice — and each is exactly the kind of per-SKU, evidence-based question RapidPricer's elasticity work was built for in the primary market. The same discipline transfers directly to the secondary one.
2. Grading curves: what condition is actually worth
A grading curve is the schedule that converts a condition tier — Like New, Good, Fair, Parts/Salvage — into a percentage of original list price. Most refurbishers set these tiers once, by category, and rarely revisit them. That's a mistake: the curve isn't static. It decays with age, and the decay rate itself varies sharply by category, because it's driven by how fast the primary market obsoletes the product, not by how fast the unit physically wears out.
We modelled resale-value retention as an exponential decay from each grade's starting multiplier, fitting the age-related decay rate separately for smartphones, laptops, and appliances against a simulated but representative intake dataset. The fitted rates confirm the intuition, but the magnitude is worth sitting with: a smartphone loses value roughly three times faster per quarter than a major appliance.
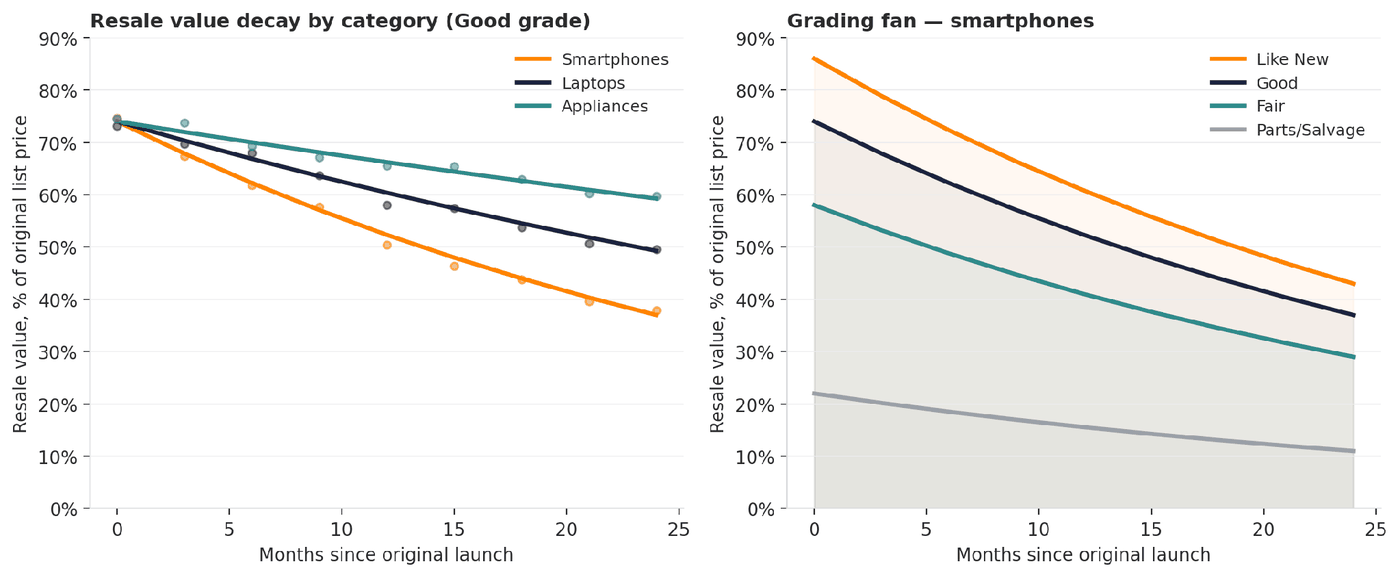
The practical read: a Good-grade smartphone retains about 52% of list value at one year old and 37% at two, against 66% and 59% for a Good-grade major appliance over the same horizon. A single flat "12% off per year" grading rule — the kind still common in category-manager spreadsheets — overpays for old phones and underpays for old appliances, in both directions eroding the margin the program is supposed to protect.
The category effect is a proxy for something more fundamental: the pace of the primary-market replacement cycle. Wherever a category's launch cadence accelerates — as it periodically does in smartphones and, increasingly, in small appliances carrying connected features — the grading curve needs re-fitting, not just re-reading. Treating it as a fixed table is the single most common source of margin leakage we see in secondary-market pricing reviews.
3. The resale floor: where inventory goes to clear
Underneath every grading curve sits a floor: the price at which, rather than continuing to discount, a refurbisher is better off harvesting the unit for parts or routing it to material recovery. Set the floor too high and units sit in inventory past their economic life, absorbing storage and capital cost while their grading curve keeps decaying underneath them. Set it too low and perfectly sellable inventory is scrapped prematurely — the direct opposite of the sustainability claim the program is built on.
The floor itself isn't the hard part; it's usually anchored to a defensible parts/scrap recovery value. The hard part is markdown cadence: how fast a unit should be walked down toward that floor as weeks in inventory accumulate, and — critically — how that cadence has to change the moment a successor model launches and resets consumer willingness to pay for the outgoing one.
We simulated a 40-week resale-price index for a single flagship-phone cohort and ran a change-point scan — the same piecewise-regression logic behind the PELT-style detection RapidPricer uses to flag structural breaks in primary-market price series — to find the week where the decay regime shifts. The scan correctly located the break at the successor-model launch, without being told where to look.
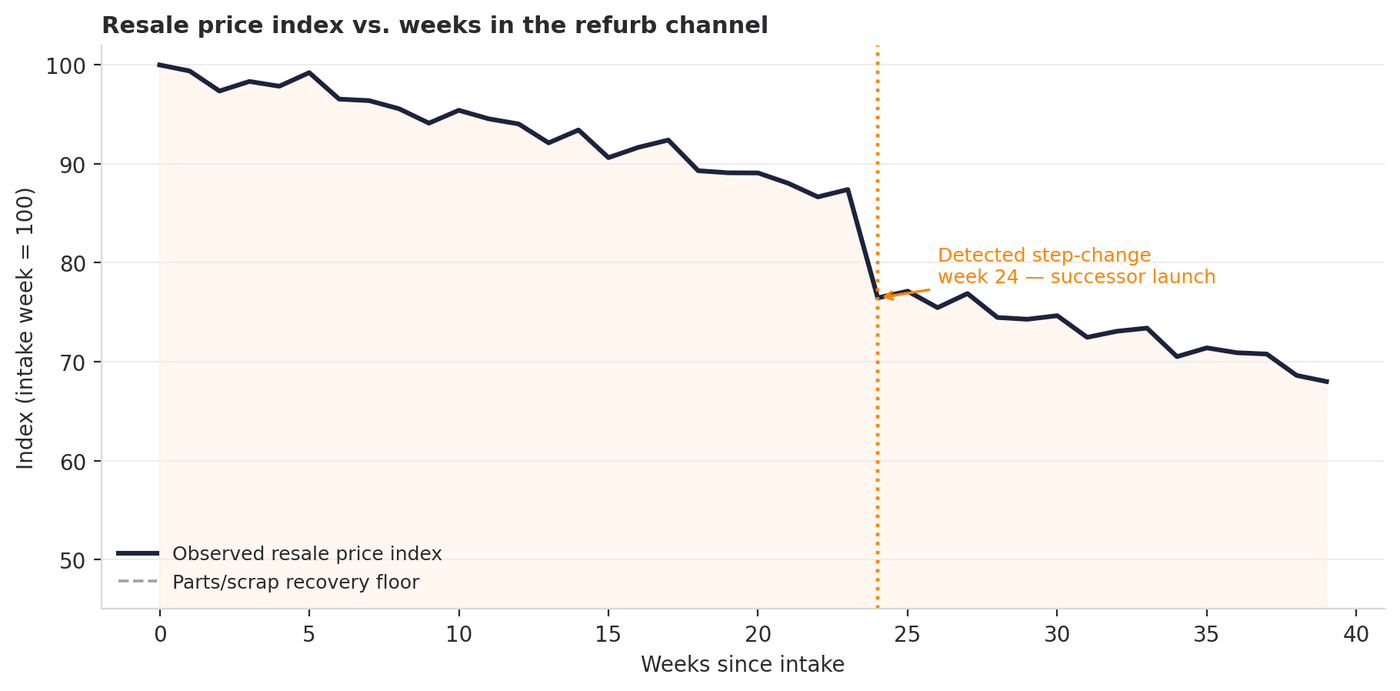
Before the break, the pre-launch decay pace would take over two years to walk the cohort down to its recovery floor — comfortably inside the unit's useful resale life. After the break, holding the same markdown pace would take almost as long again, which is exactly the trap: units caught in inventory at launch need markdown velocity to roughly double if they're going to clear before the next generation makes them unsellable at any price above scrap. A static markdown schedule, set once at intake, structurally guarantees this failure mode — it has no mechanism to react to the one event that matters most.
| Why this matters more than it looks • A floor that isn't defended with launch-aware markdown pacing doesn't fail gracefully — it fails as a cliff, where a batch of inventory crosses from "discountable" to "unsellable at any positive margin" within a few weeks of a launch date the refurbisher usually knew about six months in advance. |
|---|
4. Trade-in economics: the credit-margin trade-off
Trade-in credit is the price paid for raw supply into the refurb pipeline, and it behaves like any other price: generous credit pulls in more volume, but every additional euro of credit is a direct subtraction from the margin that unit can ultimately deliver. The two are in tension by construction, and the tension is easy to see once the margin bridge is laid out grade by grade.
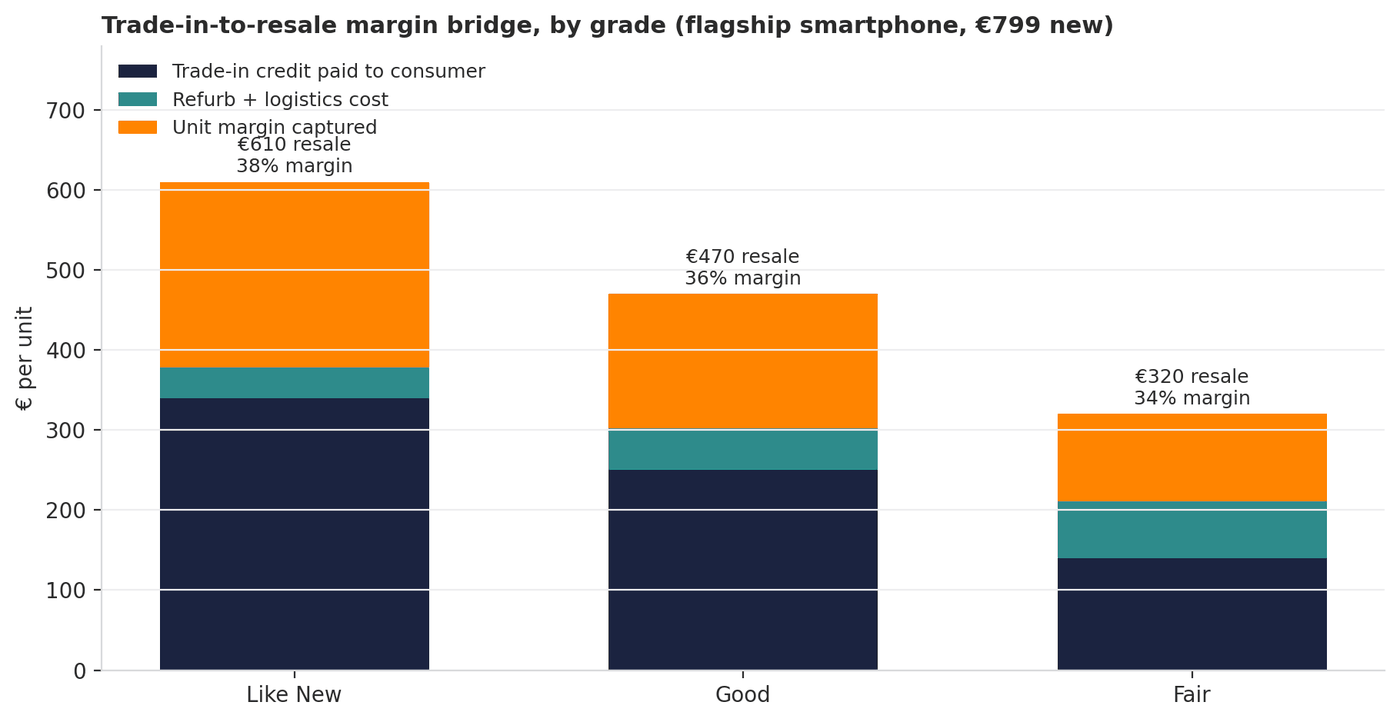
Margin percentage is remarkably stable across grades in this bridge — 34–38% — which is itself a useful diagnostic: when refurb programs see margin percentage swing sharply by grade, it's usually a sign that the grading curve and the credit schedule were set by different teams, at different times, without being reconciled against each other.
The volume side of the equation is where most programs actually leave money on the table. We modelled trade-in volume as a function of credit generosity, using a saturating uptake curve consistent with how consumers respond to buyback offers in practice — slow uptake at stingy credit levels, a steep response band in the middle, and diminishing returns once credit approaches the point where trading in stops feeling like a discount and starts feeling like the obvious default.
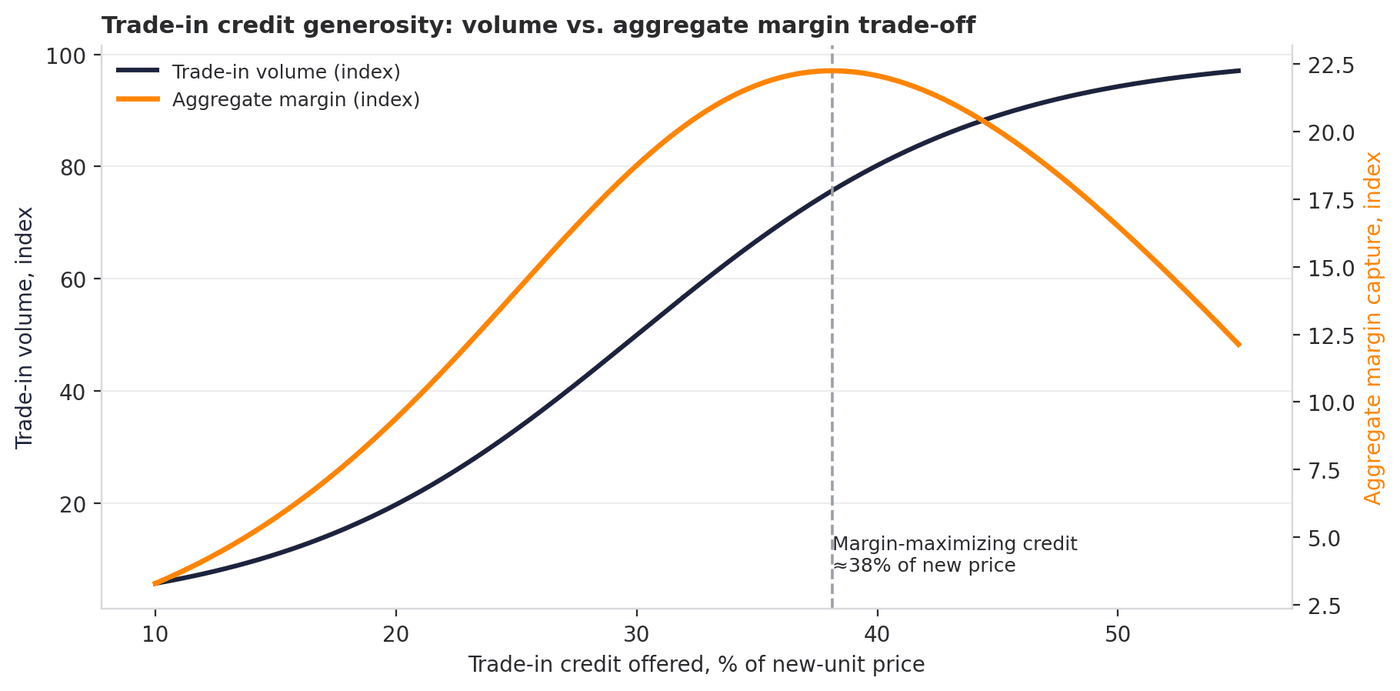
The curve has an interior maximum, which is the whole point: in this simulation, aggregate margin peaks at a credit level around 38% of new-unit price. Pushing credit up toward 45% — a level many "generous trade-in event" promotions land on instinctively — actually gives back roughly a tenth of achievable aggregate margin relative to the peak, because the added volume no longer compensates for the margin conceded per unit. Pulling credit down to 20% to protect per-unit margin costs far more: aggregate margin falls by more than half, because the supply pipeline that feeds grading and resale simply dries up.
Both errors are common, and they tend to cluster by function: marketing-led trade-in promotions overshoot the optimum in pursuit of volume and PR; finance-led buyback policies undershoot it in pursuit of unit economics. Neither side is wrong about the shape of the trade-off — they're just optimizing one half of the same curve.
5. Sustainability's hidden pricing dependency
The regulatory backdrop makes this less optional than it used to be. EU rules phasing in through 2026 push repairability, digital product passports, and extended producer responsibility onto manufacturers, and Europe's secondhand market is forecast by several trackers to roughly triple by the end of the decade. None of that regulatory or demand tailwind converts into an actual reduction in e-waste unless the pricing layer clears inventory at prices that make resale the rational choice over disposal — for both the seller setting the floor and the buyer deciding whether refurbished is worth it.
This is the part of the sustainability story that rarely makes it into the sustainability report. A refurb program with a mispriced grading curve doesn't just lose margin — it quietly ships units to scrap that a correctly priced program would have sold, and it does so while still being able to report gross recommerce volume as a circularity metric. Pricing accuracy is not adjacent to the environmental claim; in a program with a hard resale floor, it is the mechanism that decides which units actually get a second life and which ones don't.
6. What this means for pricing teams
- Re-fit grading curves per category on a cycle that matches the category's obsolescence pace, not a calendar default — smartphones need quarterly review, appliances can run annually.
- Treat successor-model launches as scheduled events that require a pre-committed markdown acceleration, not a discretionary call made after inventory has already started stalling.
- Set trade-in credit against the volume-margin curve as a whole, not against per-unit margin alone — the optimum is rarely where either marketing or finance would set it unilaterally.
- Audit grade-to-credit consistency directly: if margin percentage is diverging sharply across grades, the grading curve and the credit schedule were very likely set independently and need to be reconciled.
The methods here — piecewise change-point detection, decay-curve fitting by segment, volume-margin optimization — are the same class of tools RapidPricer applies to primary-market SKU pricing. Recommerce and trade-in pricing is a smaller, faster-moving, higher-variance version of the same problem, which is exactly why it rewards the same discipline rather than a separate playbook.
Sources: Coherent Market Insights, Transparency Market Research, MarkNtel Advisors, Research and Markets, and GSMA (2024) for market-size and adoption figures; ThredUp 13th Annual Resale Report for consumer adoption. All grading-curve, resale-floor, and margin-bridge figures in this article are illustrative, modelled scenarios built to demonstrate methodology — not client data.
RapidPricer helps automate pricing and promotions for retailers. The company has capabilities in retail pricing, artificial intelligence, and deep learning to compute merchandising actions for real-time execution in a retail environment.