
The World Cup Will Break Your Pricing. Are You Ready?
- mamta Devi
- 5 hours ago
- 5 min read


Written By: Gargi Sarma
The Opportunity Nobody Is Talking About
FIFA World Cup 2026 will be played across the United States, Mexico, and Canada from June 11 to July 19. Sixty-four matches. Sixteen host cities. An estimated 5 million international visitors and hundreds of millions of fans watching from home — many of them stopping at a convenience store or QSR before, during, and after every single game.
That is not a normal summer. That is a 39-day demand storm hitting the same categories — beer, snacks, cold beverages, ready-to-eat meals — at predictable times, in predictable locations, across tens of thousands of stores simultaneously.
"Every 6-pack of Corona sold in the two hours before kick-off is a pricing decision you already made — weeks ago."
The problem? Most retailers and QSR operators will enter this tournament with the same static price lists they use on a Tuesday in February. A flat price is not neutral. It is a choice to leave money on the table.
What the Data Tells Us
This is not speculation. We have four World Cups and more than a decade of Super Bowl data to work with. NielsenIQ and Circana convenience-channel trade reports consistently show the same pattern on major match days:
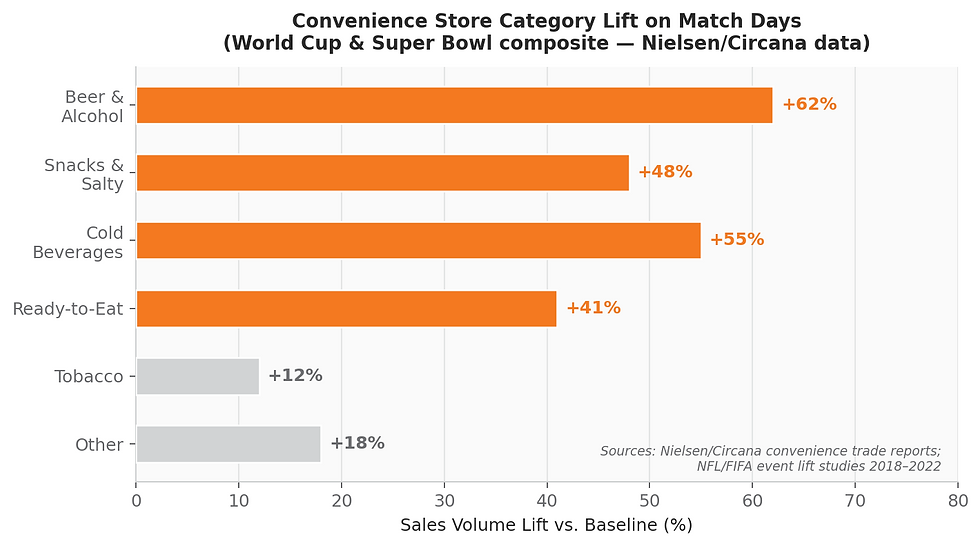
Figure 1: Average category sales-volume lift on major sporting-event days vs. baseline (NielsenIQ/Circana composite, 2018–2022).
Beer and alcohol lead the surge — up 62% on match days in host-market convenience stores. Cold beverages and salty snacks follow closely. Ready-to-eat meals spike as fans skip cooking. These are not marginal lifts. They are category-redefining events that repeat 64 times across the tournament window.
For OXXO alone — with roughly 22,000 stores across Mexico and growing US presence — even a conservative 1% improvement in revenue capture per match day translates to tens of millions of dollars across the full tournament. The numbers are not hypothetical; FEMSA's own earnings calls reference elevated same-store sales during the 2018 and 2022 World Cups.
Three Ways to Price a World Cup — and Why Two of Them Are Wrong
Most operators instinctively reach for one of two bad strategies when they think about event pricing:
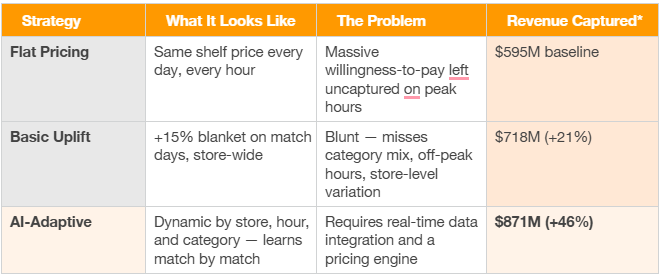
*Illustrative estimates based on 20,000 stores × 64 matches × avg. convenience store revenue benchmarks (NielsenIQ/Circana 2022). Incremental uplift versus flat-pricing baseline.
The Math Behind the Gap
The difference between a flat-pricing approach and an AI-adaptive system is not magic — it is algebra applied at scale. Consider a two-state demand model: baseline days and match days. On a match day, willingness to pay for a cold six-pack rises sharply in the two hours before kick-off and again immediately after the final whistle. A store in Monterrey serving fans heading to a watch party faces different elasticities than a downtown Mexico City location serving office workers catching highlights on their phones.
A basic uplift rule (+15% blanket) captures some of that value. But it charges the same premium at 7am as at 1pm, applies the same rate to tobacco (which barely moves) as to beer (which surges 62%), and treats a store next to a sports bar the same as one in a residential neighbourhood three kilometres away.
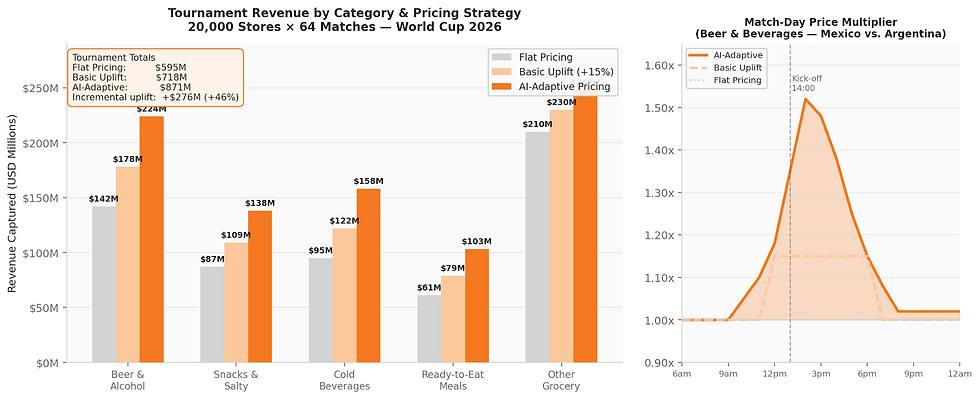
Figure 2: Modelled revenue capture by category and pricing strategy across the World Cup 2026 tournament window (64 matches, 20,000 stores). Inset shows within-day price multiplier trajectory for a Mexico match day, beer & beverages category.
An adaptive system — one that adjusts by store, by hour, and by category — captures the full demand curve. It knows that beer elasticity at 1:00pm on a Mexico vs. Argentina match day is different from 9:00pm on a Canada vs. Morocco group-stage game. It learns after each of the 64 matches, improving its predictions for the next round. By the semi-finals, it is operating with six weeks of tournament-specific demand data.
Across 20,000 stores and 64 matches, that systematic improvement compounds into hundreds of millions of dollars in additional revenue — revenue that exists, that customers are willing to spend, and that flat pricing simply does not collect.
This Is Not Just a World Cup Problem
The World Cup is the most dramatic example, but it is not the only one. Every major sporting event, national holiday, or weather extreme creates the same two-state demand problem — a baseline and a surge that legacy pricing systems treat identically.
For OXXO, 7-Eleven Mexico, Circle K, Wawa, Casey's, or any regional QSR chain, the calendar is full of these moments: Super Bowl Sunday, Copa América, local derby days, heat waves (cold beverage surge), cold snaps (hot beverage surge), payroll Fridays, and long-weekend travel traffic. Each one is a mini World Cup for a subset of your store network.
"Static pricing is a strategy — just not a very good one. It is a choice to charge the same price to the fan who would have paid double and the casual shopper who is price-sensitive. You lose on both ends."
The retailers who will win over the next decade are those building the infrastructure to respond to demand signals in real time — not those scrambling to update price files the morning of a big match.
What Good Looks Like: The RapidPricer Approach
At RapidPricer, we have spent years building exactly this capability for convenience retail and QSR operators. Our platform integrates with point-of-sale systems to ingest real-time transaction data, layers in external signals (match schedules, weather, local events, competitor activity), and outputs store-level, category-level price recommendations on a continuous basis.
For the World Cup, this means:
Pre-tournament calibration using historical lift data from 2018 and 2022 World Cups, segmented by store cluster, catchment profile, and category.
Match-day price trajectories that ramp up in the pre-kick-off window, sustain through the match, and taper post-final-whistle — automatically, without a pricing manager manually updating every SKU.
Learning loops that update elasticity estimates after each match, so the system gets progressively sharper from group stage through to the final.
Guardrails that prevent pricing decisions that could damage brand trust — no predatory spikes on essential goods, no price gouging in vulnerable communities.
The result is not just more revenue during the tournament. It is a pricing infrastructure that continues delivering returns on every major demand event that follows — and there is always another one coming.
Methodology & Data Sources
Data & Modelling
Category lift figures: NielsenIQ and Circana convenience-channel trade reports; FIFA 2018/2022 host-market retailer surveys; NFL Super Bowl convenience benchmarks (composite 2018–2022).
Revenue model: two-state demand framework (baseline vs. match-day) with category-level price elasticities. Monte Carlo simulation over 64 matches × 20,000 stores using pandas/NumPy. Store-level parameters drawn from FEMSA/OXXO investor presentations and publicly available convenience-store revenue benchmarks (~$1.1M–$1.4M annual revenue per store).
Pricing literature: Cachon, Daniels & Lobel (2017), "The Role of Surge Pricing on a Service Platform with Self-Scheduling Capacity," Manufacturing & Service Operations Management; Berri & Schmidt (2006), sports demand elasticity; Uber surge-pricing academic literature (Cohen et al., 2016).
Revenue figures are illustrative estimates based on the cited sources and publicly available data. They are intended to indicate order-of-magnitude opportunity and should not be taken as guarantees of performance for any specific retailer.
"AI-Generated Content Disclaimer
This content was generated in part with the assistance of artificial intelligence tools. While efforts have been made to review, edit, and ensure the accuracy, completeness, and reliability of the content, it may still contain errors or omissions. It should not be considered professional advice, and users should independently verify any information before making decisions based on it. The publisher/author assumes no responsibility or liability for any consequences resulting from reliance on this content."
Read More On
The Always-On Shelf: How Real-Time Competitive Data Is Rewriting Retail Pricing
The Pricing DD Blind Spot: How Much Margin Are PE-Backed Food Retailers Really Leaving on the Floor
Retailers Don't Need More Reports. They Need Automated Intelligence
Daypart Pricing: Why Time-of-Day Intelligence Matters as Much in Convenience Retail as in Fast Food
From QSR Menu Boards to Grocery ESLs: Digital Screens as Real-Time Pricing Engines
World Cup 2026: The Pricing Playbook for Retailers and QSRs in Mexico, Canada, and the US


Comments